How to Build a Claude Dashboard for Google, Meta and TikTok Ads
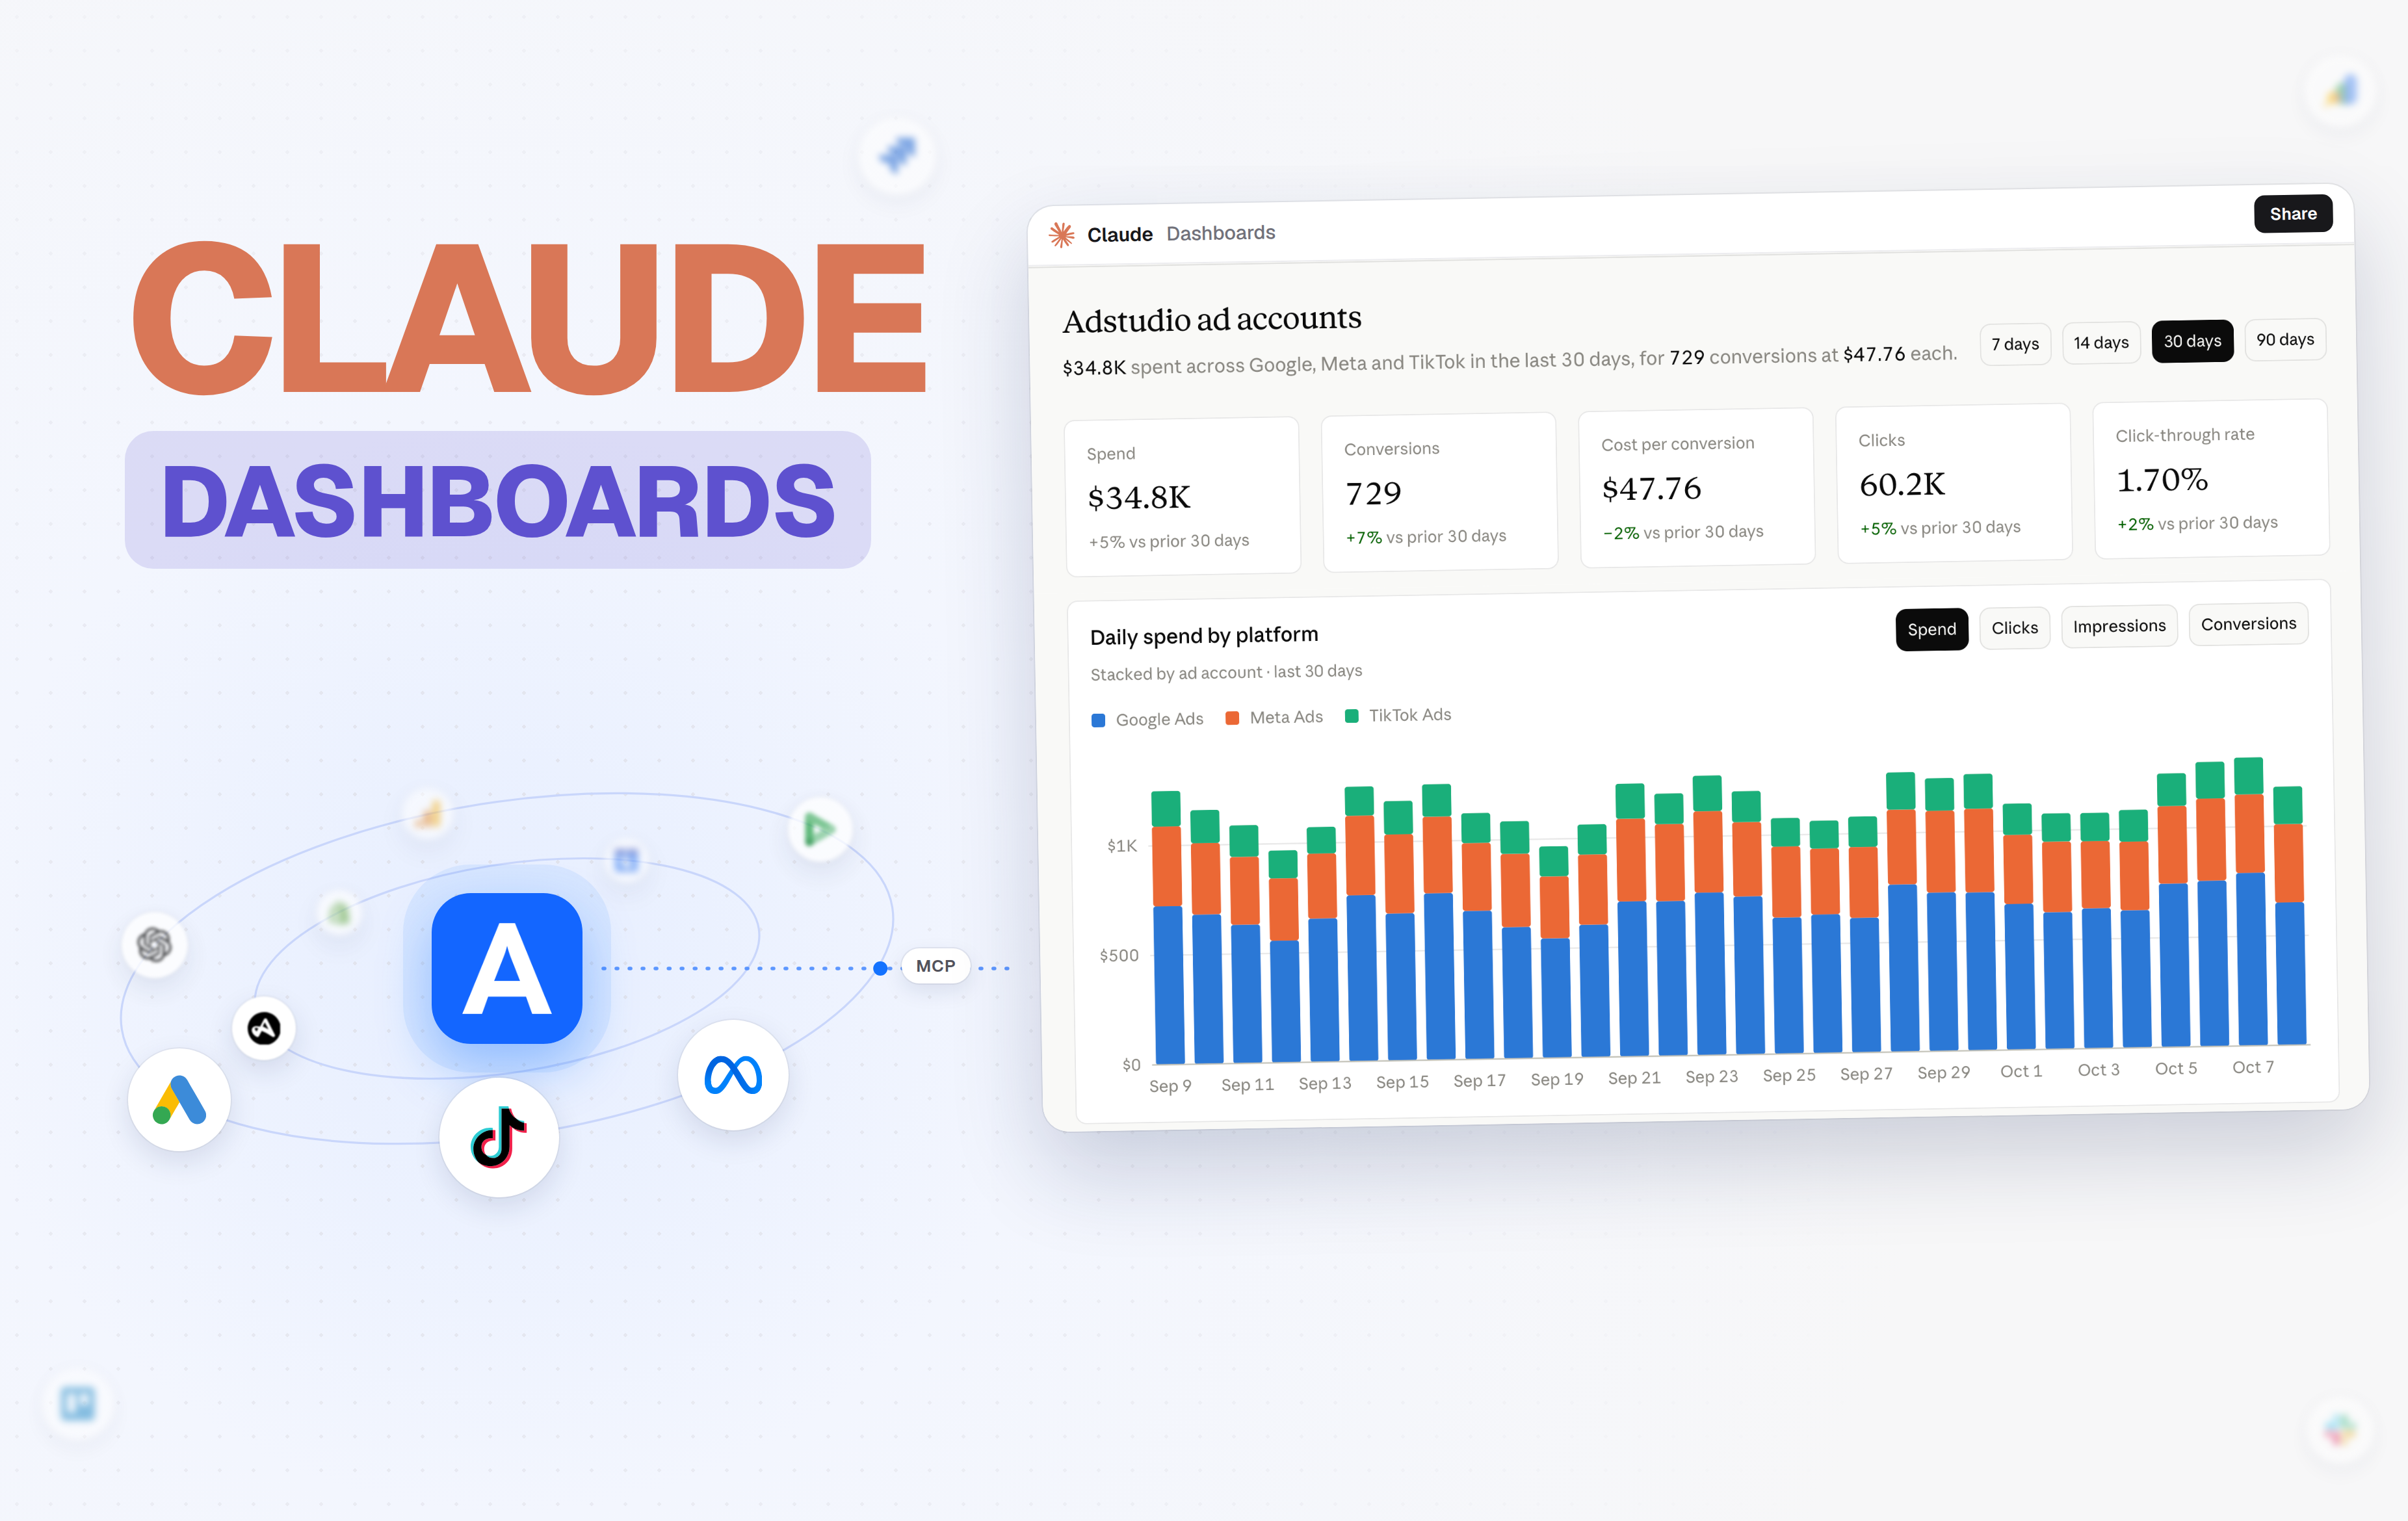
To build a Claude dashboard for your ad accounts, connect Adstudio to Claude as a custom connector, then ask Claude for the dashboard in plain words, for example "Create a dashboard for my ad accounts across Google, Meta and TikTok." Claude Dashboards builds the page and Adstudio supplies the live Google Ads, Meta Ads and TikTok Ads data through MCP, so the numbers reload every time someone opens it. The whole setup takes a few minutes and needs no warehouse, no SQL and no spreadsheet export.
TL;DR
- Anthropic launched Claude Dashboards in beta on October 8, 2026, on paid Claude plans. It builds dashboards from plain-language requests and keeps them current.
- Claude Dashboards works with your connectors, so ad data arrives the same way: connect Adstudio once and Claude can chart Google Ads, Meta and TikTok in one view.
- One prompt gives you spend, conversions, cost per conversion, clicks, CTR, a daily spend chart stacked by platform and date-range toggles.
- Every viewer loads the numbers through their own Adstudio access, so sharing a dashboard never exposes an account someone isn't allowed to see.
- Platforms count conversions their own way. Label that on the dashboard instead of adding them up blindly.
What is Claude Dashboards?
Claude Dashboards is a Claude feature that turns a question about your data into a dashboard that stays current. Anthropic announced it on October 8, 2026, in beta on paid plans. You connect a data source, ask in plain language, and Claude builds the charts. Each chart shows when its data was last refreshed, and you can click any number to see the query behind it or ask Claude to explain it.
Anthropic's launch examples are data platforms such as BigQuery, Databricks and Snowflake, and CRM tools like Salesforce. The announcement also says Dashboards "works with your other connectors too". That sentence is the one that matters for marketers: ad accounts don't live in a warehouse for most teams, they live in Google Ads, Meta Ads Manager and TikTok Ads Manager. A connector that reads those accounts makes them a dashboard source like any other.
On Enterprise plans, Dashboards is off by default and an admin turns it on under Organization settings → Artifacts, per the same announcement.
Can Claude Dashboards connect to Google Ads, Meta Ads and TikTok Ads?
Yes, through an MCP connector. Claude has no built-in Google Ads, Meta or TikTok connection, so you add one as a custom connector. Adstudio's MCP server is that connector: one sign-in gives Claude access to the ad accounts in your Adstudio workspace, across all three platforms, with the account names, currencies and metrics already normalized.
That last part is the difference between a dashboard that works on the first prompt and one that needs an afternoon of fixing. Google Ads reports cost in micros, Meta splits results by action type, and TikTok names its metrics differently again. Adstudio returns them as one consistent set of fields, so Claude can put Google Ads spend and Meta spend in the same stacked bar without you explaining each API.
If you want the background on MCP itself, read ad platform MCP servers explained.
How do I set up a Claude dashboard for my ad accounts?
- Connect your ad accounts in Adstudio. Sign in at useadstudio.com, create a workspace and connect Google Ads, Meta Ads and TikTok Ads. This is the access Claude will read through.
- Add Adstudio to Claude. In Claude, open Customize → Connectors, select +, then Add custom connector. Paste
https://useadstudio.com/api/mcpand select Add. The Claude setup page has the same steps with screenshots. - Sign in. Select Connect and log in with your Adstudio account. On Team and Enterprise, an owner can add Adstudio once under Organization settings → Connectors, and everyone then connects with their own login.
- Turn the connector on in a chat. Open + → Connectors and switch Adstudio on.
- Ask for the dashboard. Start with the prompt in the next section.
A good first check: ask Claude "List my ad accounts in Adstudio" before asking for any chart. If every account you expect shows up, the dashboard will see them too.
What prompt builds a cross-platform ads dashboard?
The dashboard in the banner above came from one short request:
"Create a dashboard for Adstudio ad accounts."
What came back:
- A one-line summary at the top: total spend across Google, Meta and TikTok for the period, conversions, and cost per conversion.
- Six metric cards: spend, conversions, cost per conversion, clicks, click-through rate and impressions, each with the change against the previous period of the same length.
- A daily spend chart stacked by ad account, with buttons to switch the chart to clicks, impressions or conversions.
- Date-range toggles that reload every card and chart at once.
If you want a specific layout from the first try, spell it out: "Create a dashboard for my Adstudio ad accounts: spend, conversions, cost per conversion, clicks and CTR across every platform, a daily spend chart stacked by platform, and 7/14/30/90-day toggles."
After that, ask for changes the way you'd ask a colleague. Claude suggested these next steps itself:
- "Add a table of campaigns ranked by spend, with cost per conversion next to each."
- "Let me click a campaign to filter the whole page to it."
- "Break spend down by device and by placement."
- "Add a custom date picker next to the presets."
Each change edits the dashboard in place. Because Claude keeps the query behind every chart, you can open the data sources, see exactly what was asked of Adstudio, and download any of it as a CSV.
How does refresh work, and who can see a shared dashboard?
The numbers load each time someone opens, refreshes or filters the dashboard. There is no copy of your data sitting inside the dashboard going stale: every load asks Adstudio for current figures, which come straight from the ad platforms.
Sharing is where this design pays off. Anthropic lets you share dashboards with your team, and with people outside your organization if your admin allows it. When someone opens a shared ads dashboard, the data loads through their own Adstudio connection. A teammate who can see the workspace sees the numbers; someone without that access sees nothing from your accounts. You can send one link to the whole team without auditing who should see which ad account, because Adstudio's workspace permissions already decide that.
For clients, the same idea applies: add them to the Adstudio workspace with the access they should have, or use Adstudio's own shared report links. How to share a live ad dashboard with a client compares the options.
Claude dashboard vs Looker Studio vs native reports: which should I use?
| Claude dashboard + Adstudio | Looker Studio | Native platform reports | |
|---|---|---|---|
| Google Ads, Meta and TikTok in one view | Yes, through one connector | Google Ads natively; Meta and TikTok through partner connectors | One platform per tool |
| How you build it | Ask in plain language | Drag charts, map fields | Pick columns per report |
| Changing it | Ask for the change | Edit charts and data sources | Rebuild the report |
| Refresh | Live on every open | Per data source freshness settings | Live, inside each platform |
| Ask "why did CPA jump?" next to the chart | Yes, in the same chat | No | No |
| Sharing | Viewer's own Adstudio access decides what they see | Owner's or viewer's credentials, set per data source | Platform user access |
If you already spend Monday mornings in three Ads Managers and a spreadsheet, the Claude route removes the most steps. It is also the only one where the analysis and the dashboard live in the same place: look at the chart, then ask why Meta's cost per conversion moved, and get an answer from the same data. For the broader picture of one-report options, see how to see Google, Meta and TikTok ad spend in one report.
What should I check before I trust the numbers?
A dashboard that adds platforms together makes cross-platform differences easy to miss. Three checks catch most of them:
- Conversions are not the same event everywhere. Google Ads counts the conversion actions you set as primary, Meta counts results for each ad set's goal, TikTok counts its own optimization events, and each uses its own attribution window. Adding them gives you "platform-reported conversions", not purchases. Ask Claude to label the card that way, or to show conversions per platform instead of a total. Why Meta Ads and GA4 numbers don't match explains the gap in detail.
- Currencies. If your accounts bill in different currencies, ask Claude to show spend per currency or to state which currency the totals use.
- Today is incomplete. The newest day is still filling in. For comparisons, ask for "the last 30 complete days" so a half-day doesn't look like a drop.
Then compare one number by hand: open Google Ads, set the same date range, and check that spend matches the dashboard's Google Ads share. Once it does, the rest of the page is the same query with different filters.
Do I need Claude Dashboards to get an ads dashboard in Adstudio?
No. Adstudio has its own cross-platform dashboard and an AI assistant that reads the same accounts, so you can get the overview and ask "what changed this week?" without leaving Adstudio. The Google Ads, Meta Ads and TikTok Ads pages show what the assistant does on each platform.
Claude Dashboards is the better fit when your team already works in Claude and wants the ads view next to everything else Claude builds for them: a revenue dashboard from the warehouse, a pipeline dashboard from the CRM, and now spend and conversions from every ad platform, all from one connector. See pricing for what each Adstudio plan includes.
FAQ
Which Claude plans include Dashboards?
Anthropic launched Claude Dashboards in beta on paid Claude plans on October 8, 2026. On Enterprise, an admin turns it on under Organization settings → Artifacts. Check Anthropic's announcement for the current plan list.
Does a Claude dashboard update automatically?
It reloads its data whenever someone opens, refreshes or filters it. With Adstudio as the source, that means current figures from Google Ads, Meta Ads and TikTok Ads on every load. Each chart shows when it was last refreshed.
Can I share a Claude ads dashboard with my team?
Yes. Share it from Claude like any other dashboard. Each viewer sees the data through their own Adstudio access, so teammates with access to the workspace see the numbers and nobody sees accounts they aren't permitted to.
Can Claude combine Google Ads and Meta Ads conversions into one number?
It can, and the dashboard in this guide does. Label that total "platform-reported conversions", because each platform counts conversions with its own events and attribution window. For decisions, compare conversions and cost per conversion per platform side by side.
Do I need SQL or a data warehouse for this?
No. Adstudio reads the ad platforms directly and Claude writes the queries. You only write the request in plain language, and you can open any chart's query if you want to see what it asked for.
Is the Adstudio connector the same one ChatGPT uses?
Yes. Adstudio is one MCP server for every AI client. The same connection works in ChatGPT and in Claude, so you set up your ad accounts once.